Epi Profile Section 3 – Texans with New HIV Diagnoses
Overall Trends and Profile of Texans with New HIV Diagnoses
In 2018, 4,520 Texans were newly diagnosed with HIV, which means that every day about 12 Texans were diagnosed with HIV. The annual number of people with new HIV diagnoses has remained constant for the last 10 years (Figure 6).
Although the overall number of people with new diagnoses were flat over the past decade, new diagnoses decreased in Black women, PWID, and people who acquired HIV through heterosexual sex. The number of diagnoses in Hispanic MSM increased. These trends are shown later in this section.
Figure 6: Number of Texans with new diagnoses, 2009-2018
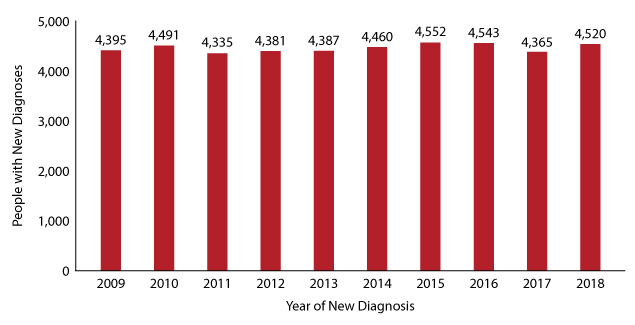
Source: Texas eHARS, 2018
Data for Figure 6
The diagnosis rate for Texas fell by 11% over the past 10 years. Since the overall annual number of Texans with new diagnosis did not change, the decline in rate is likely due to the increases in the total population of Texas.
Figure 7: Rate of Texans with new diagnoses, 2009-2018
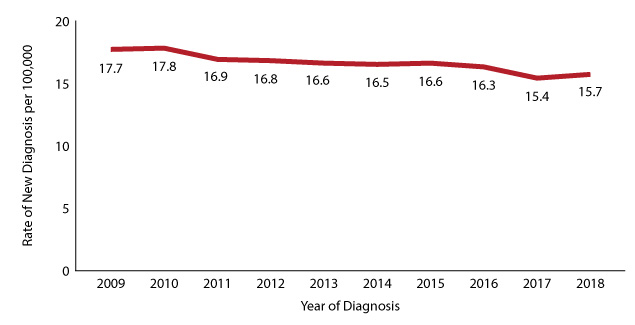
Source: Texas eHARS, 2018
Data for Figure 7
The profile of Texans with new diagnoses in 2018 shows a continuation of recent trends:
- Four out of five people with new diagnoses were male; [8]
- Three out of four were Black or Hispanic;
- Three out of five were younger than 35;
- At least half were Hispanic and Black MSM; and
- Black and MSM Texans had disproportionately high diagnosis rates.
Table 9 at the end of this section shows detailed breakdowns of profile of Texans with new diagnoses over time.
Texans with New Diagnoses by Race/Ethnicity and Sex at Birth
Even though the overall number of Texans with new diagnoses was steady across the years, this masked changes. The number of Black Texans with new diagnoses fell by about 6% from 2009-2018, while the number of new diagnoses in Hispanic Texans rose by 19% (Figure 8 and Table 9). The decrease in Black Texans was driven primarily by decreases among Black women, and the increase in Hispanic Texans was driven by increases in Hispanic MSM.
Figure 8: Texans with new HIV diagnoses by race/ethnicity, 2009-2018

Data for Figure 8
The decrease in the number of Black Texans with new diagnoses led to a 22% decrease in the diagnosis rate for this group (Figure 9). Despite this decrease, the diagnosis rate for Black Texans was 2.8 times higher than the rate for Hispanic Texans, the group with the next highest rate. The diagnosis rate for Black females is five times higher than the rate for Hispanic females, the group with the next highest rate (Table 5).
Figure 9: Rates of new HIV diagnosis in Texas by selected race/ethnicity groups, 2009-2018

Source: eHARS, 2018
Data for Figure 9
Table 5: Texans with new diagnoses and diagnosis rates by sex at birth and selected race/ethnicities, 2018
|
Males |
Females |
Total |
|||||||
|
Race/Ethnicity |
Number |
% |
Rate |
Number |
% |
Rate |
Number |
% |
Rate |
|
White |
790 |
21% |
13.4 |
119 |
15% |
2.0 |
909 |
20% |
7.6 |
|
Black |
1,169 |
32% |
70.2 |
415 |
51% |
23.4 |
1,584 |
35% |
46.0 |
|
Hispanic |
1,565 |
42% |
27.3 |
250 |
31% |
4.4 |
1,815 |
40% |
16.0 |
|
All Others |
178 |
5% |
34 |
4% |
212 |
5% |
|||
|
TOTAL |
3,702 |
26.0 |
818 |
5.7 |
4,520 |
100% |
15.7 |
||
Texans with New Diagnoses by Age
The age profile of Texans who were diagnosed in 2018 varies by sex at birth in ways that have implications for designing testing and treatment programs. The profile of males leans towards younger ages and reflects increases in new diagnoses in young MSM of color. The age of females at diagnosis is tilted towards older women, with one in three females diagnosed in 2018 being 45 or older. During discussions in changes of the age profile of those newly diagnosed, keep in mind these differences.
Figure 10: Age profiles of Texans with new HIV diagnoses by sex at birth, 2018

Across the last 10 years, at least half of the newly diagnosed Texans were younger than 35 years old (Figure 11). New diagnosis in the 25-34-year-old age group increased by 25% over the past 10 years with consistent year after year increases.
Trends in youth (15-24-year-olds) are more complex. Comparing the number of new diagnoses in youth in 2009 and in 2018 makes it appear that the number of diagnoses made in this group was stable, but this is not the case. Between 2009 and 2013, the number of new diagnoses in youth increased, but between 2014 and 2018, the number of youth with new diagnoses fell by 11%. This decrease mirrors changes in the number of youth with new HIV infections, which fell significantly from 2010 to 2017 (data not shown).
While the decrease in new infections in youth is good news, the decrease in new diagnoses is a problem. Since we estimate that only about half of the youth living with HIV have been diagnosed (data not shown), the number of youth diagnosed each year needs to increase to assure full diagnosis and participation in care, and these efforts should be focused on young MSM.
Figure 11: Texans with new diagnoses by age, 2009 - 2018

Data for Figure 11
Table 6: Texans diagnosed with HIV in 2018 by sex at birth and age
|
Males |
Females |
Total |
|||||||
|
Age group (years) |
Number |
% |
Rate |
Number |
% |
Rate |
Number |
% |
Rate |
|
0-14 |
5 |
<1% |
0.2 |
4 |
<1% |
0.1 |
9 |
<1% |
0.2 |
|
15-24 |
897 |
24% |
43.4 |
125 |
15% |
6.4 |
1,022 |
23% |
25.4 |
|
25-34 |
1,429 |
39% |
66.2 |
223 |
27% |
10.7 |
1,652 |
37% |
39.0 |
|
34-44 |
672 |
18% |
34.5 |
195 |
24% |
10.1 |
867 |
19% |
22.3 |
|
45-54 |
450 |
12% |
25.5 |
159 |
19% |
8.9 |
609 |
14% |
17.1 |
|
55-64 |
198 |
5% |
12.6 |
90 |
11% |
5.4 |
288 |
6% |
8.9 |
|
65+ |
51 |
1% |
3.2 |
22 |
3% |
1.1 |
73 |
2% |
2.0 |
|
TOTAL |
3,702 |
26.0 |
818 |
5.7 |
4,520 |
100% |
15.7 |
||
Texas HIV Epidemiologic Profile