Border Report Section 3 – Population and Demographics of the Texas-Mexico Border Region
About 10 percent of Texas’ population resides within a Texas-Mexico border county. The vast majority (76%) of this population is concentrated in Hidalgo (31%), El Paso (30%) and Cameron (15%) counties.
Table 1: Population by EMA/TGA
| EMA/TGA | 2017 Population | Percent |
|---|---|---|
|
Texas |
28,304,596 |
100.0% |
|
Houston EMA |
6,165,148 |
21.8% |
|
Dallas EMA |
4,992,188 |
17.6% |
|
Texas-Mexico Border |
2,782,553 |
9.8% |
|
East Texas |
2,744,875 |
9.7% |
|
Fort Worth TGA |
2,413,512 |
8.5% |
|
San Antonio TGA |
2,308,550 |
8.2% |
|
Austin TGA |
2,115,827 |
7.5% |
|
All Other Texas |
4,781,943 |
16.9% |
Source: National Center for Health Statistics, 2017
Similar to the rest of Texas, the Texas-Mexico border region has experienced a population growth of 13.4 percent over the past 10 years (Figure 2). Population growth in this region is likely driven by cross-border migration from Mexico. The higher birth rate among Hispanics (1,790 per 100,000 Hispanic persons vs. 1,469 per 100,000 persons of all race/ethnicities), which comprise a majority of the population in the Texas-Mexico border region, may also drive population growth.
Figure 2. Population Growth 2007-2017 by Region
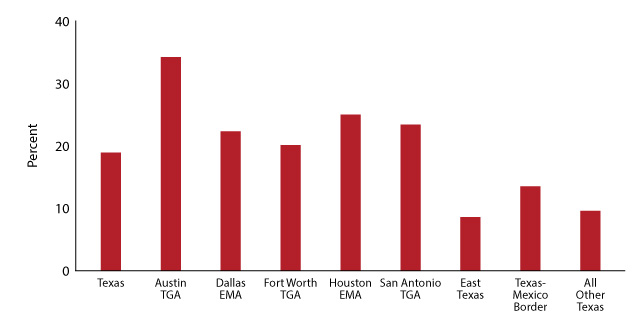
Source: National Center for Health Statistics, 2017
Data for Figure 2
The majority (89%) of residents of the Texas-Mexico border region identify as Hispanic/Latino, compared to 40 percent of all Texans.
Figure 3. Racial Composition of Texas Population by Region
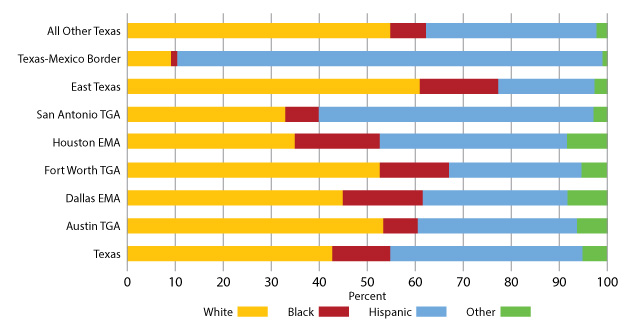
Source: National Center for Health Statistics, 2017
Data for Figure 3
Rates of poverty are significantly higher along the Texas-Mexico border compared to the rest of Texas. Twenty-three percent of all persons in the Texas-Mexico border counties are living under the Federal Poverty Line, and 25 percent of persons in the border counties lack health insurance. Among employed persons, health insurance coverage is even lower (Table 2). The economy in the Texas-Mexico border region is based on agriculture and manufacturing, and jobs in these industries may be seasonal and informal. According to the Texas Department of Insurance, businesses in Texas are not required to provide health insurance for seasonal and part-time work or if a business has less than 50 employees.
A large proportion of employed persons in the Texas-Mexico border region may work contract or part-time unskilled jobs, which do not provide health insurance benefits.
Table 2: Mean Poverty and Health Insurance Indicators, by EMA/TGA, 2016
| EMA/TGA | % of Persons with No Health Insurance | % of Employed Persons with No Health Insurance | % of all People Under Poverty Line | % of Persons 18-64 Under the Poverty Line | % of Persons Over 18 Under the Poverty Line | % of Families Under the Poverty Line |
|---|---|---|---|---|---|---|
|
Austin TGA |
16% |
19% |
14% |
14% |
13% |
10% |
|
Dallas EMA |
17% |
20% |
13% |
12% |
11% |
10% |
|
Fort Worth TGA |
17% |
21% |
12% |
11% |
10% |
9% |
|
Houston EMA |
18% |
21% |
14% |
13% |
12% |
10% |
|
San Antonio TGA |
15% |
18% |
12% |
11% |
10% |
9% |
|
East Texas |
19% |
24% |
18% |
17% |
15% |
13% |
|
Texas-Mexico Border |
25% |
33% |
23% |
19% |
20% |
19% |
|
All Other Texas |
19% |
24% |
16% |
15% |
14% |
12% |
Source: American Community Survey, 2016 5-year estimates, table DP03
Of the ten Texas counties with the highest rates of poverty among adults aged 18-64 years and the highest percent of employed adults with no health insurance, eight are located within the Texas-Mexico border region. In three of these border counties, fewer than 50 percent of employed adults lack health insurance (see Tables 3a and 3b).
Table 3a: Top 10 counties with the highest levels of poverty, 2016
| Rank | County | % of Persons 18-64 Living Under Federal Poverty Line |
Region |
|---|---|---|---|
|
1 |
Willacy County |
33% |
Texas-Mexico Border |
|
2 |
Starr County |
32% |
Texas-Mexico Border |
|
3 |
Hudspeth County |
30% |
Texas-Mexico Border |
|
4 |
Brooks County |
30% |
Texas-Mexico Border |
|
5 |
Brazos County |
30% |
All Other Texas |
|
6 |
Zapata County |
30% |
Texas-Mexico Border |
|
7 |
Walker County |
28% |
East Texas |
|
8 |
Cameron County |
28% |
Texas-Mexico Border |
|
9 |
Zavala County |
27% |
Texas-Mexico Border |
|
10 |
Hidalgo County |
27% |
Texas-Mexico Border |
Source: American Community Survey, 2016 5-year estimates, table DP03
Table 3b: Top 10 counties with the lowest levels of health insurance coverage, 2016
| Rank | County | % of Employed Persons with No Health Insurance |
Region |
|---|---|---|---|
|
1 |
Starr County |
58% |
Texas-Mexico Border |
|
2 |
Jim Hogg County |
50% |
Texas-Mexico Border |
|
3 |
Motley County |
50% |
All Other Texas |
|
4 |
Hidalgo County |
50% |
Texas-Mexico Border |
|
5 |
Zapata County |
48% |
Texas-Mexico Border |
|
6 |
Real County |
48% |
Texas-Mexico Border |
|
7 |
Maverick County |
46% |
Texas-Mexico Border |
|
8 |
Cameron County |
45% |
Texas-Mexico Border |
|
9 |
Webb County |
45% |
Texas-Mexico Border |
|
10 |
Concho County |
44% |
All Other Texas |
Source: American Community Survey, 2016 5-year estimates, Table S2701
Figure 4. Percent of Population Living under Federal Poverty Level, 2016
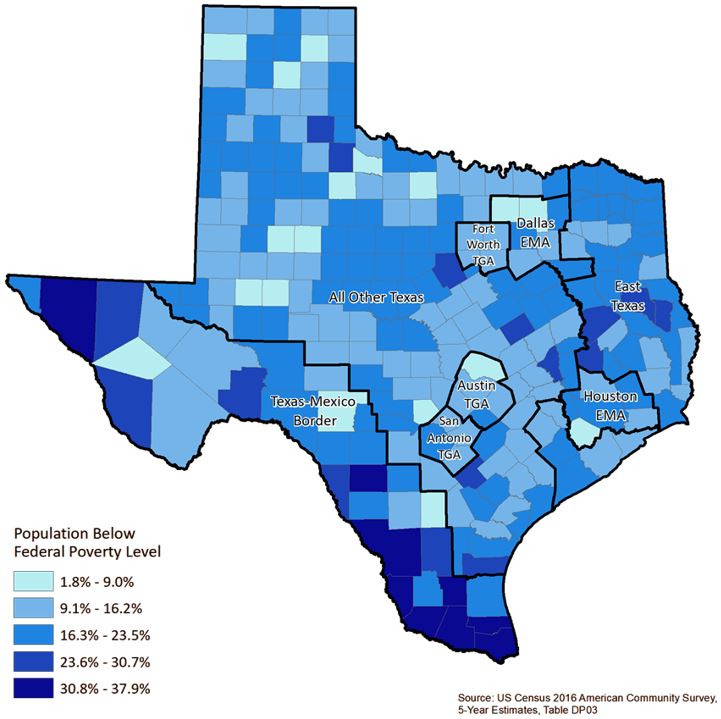
Data for Figure 4
Both poverty and a lack of health insurance can make the cost of accessing medical care, including screening for HIV, STDs, and TB, prohibitive. Additionally, the rural nature of certain counties can impact the availability of medical care.
HIV, STDs, and TB in the Texas-Mexico Border Region